This is a quick reference with Python snippets that can be used to describe the shape, composition, and distribution of a data set. The following statements will help identify potential gaps, irregularities, and biases in the underlying data before applying it to a machine learning problem. The majority of these use Python’s Pandas library and evaluate the data set within a DataFrame.
.shape
# describes the DataFrame in rows, columns
data = read_csv('filename.csv')
shape = data.shape
print(shape)

.head(n)
.tail(n)
# describes the first (head) or last (tail) n rows of a data file
data = read_csv('filename.csv')
head = data.head(10)
print(head)

.describe()
# lists statistical properties of each attribute: Count, Mean, Standard Deviation, # Minimum Value, Percentiles (25th, 50th, 75th, max)
data = read_csv('filename.csv')
description = data.describe()
print(description)

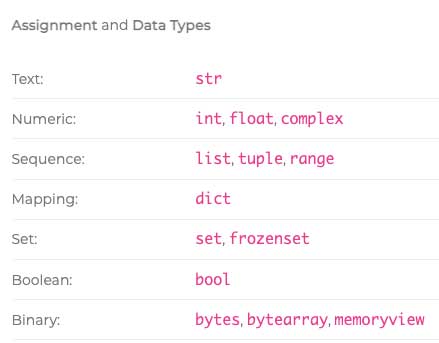
.dtypes()
# describes the data type for each attribute
data = read_csv('filename.csv')
types = data.dtypes
print(types)

.set_option()
# lets you change the precision of the numbers and the preferred width of the output.
data = read_csv('filename.csv')
set_option('display.width', 100)
set_option('precision', 3)

.groupby()
# describes the distribution of a given column or attribute in Pandas
data = read_csv('filename.csv')
counts = data.groupby('columnName').size()
print(counts)

.corr()
# expresses the correlations between attributes.
data = read_csv('filename.csv')
correlations = data.corr(method='pearson')
print(correlations)

.skew()
# indicates how an attribute deviates from a typical gaussian/bell curve
data = read_csv('filename.csv')
skew = data.skew()
print(skew)

